Coloring plot of the Riemann ζ function

This is a "complex domain coloring" plot of the Riemann ζ function on the rectangle 0 ≤ x ≤ 2, −200 ≤ y ≤ 0.

If we continued down to about y=−7005, we would find the following interesting place:

Zeta near z = .5−7005i

What at first glance looks like a double zero will, when sufficiently magnified, look like this:
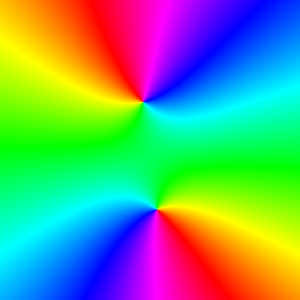
Zeta even nearer z = .5−7005i

Zeta function between 0 and 1−20i Zeta function between 1 and 2−20i

ζ(x+iy) for y between −20 and 0
Zeros in this interval:

  • y=−14.13473
Zeta function between 20i and 1−40i Zeta function between 1−20i and 2−40i

ζ(x+iy) for y between −40 and −20
Zeros in this interval:

  • y=−21.02204
  • y=−25.01086
  • y=−30.42488
  • y=−32.93506
  • y=−37.58618
Zeta function between 40i and 1−60i Zeta function between 1−40i and 2−60i

ζ(x+iy) for y between −60 and −40
Zeros in this interval:

  • y=−40.91872
  • y=−43.32707
  • y=−48.00515
  • y=−49.77383
  • y=−52.97032
  • y=−56.44625
  • y=−59.34704
Zeta function between 60i and 1−80i Zeta function between 1−60i and 2−80i

ζ(x+iy) for y between −80 and −60
Zeros in this interval:

  • y=−60.83178
  • y=−65.11254
  • y=−67.07981
  • y=−69.54640
  • y=−72.06716
  • y=−75.70469
  • y=−77.14484
  • y=−79.33738
Zeta function between 80i and 1−100i Zeta function between 1−80i and
	       2−100i

ζ(x+iy) for y between −100 and −80
Zeros in this interval:

  • y=−82.91038
  • y=−84.73549
  • y=−87.42527
  • y=−88.80911
  • y=−92.49190
  • y=−94.65134
  • y=−95.87063
  • y=−98.83119
Zeta function between 100i and 1−120i Zeta function between 1−100i and 2−120i

ζ(x+iy) for y between −120 and −100
Zeros in this interval:

  • y=−101.31785
  • y=−103.72554
  • y=−105.44662
  • y=−107.16861
  • y=−111.02954
  • y=−111.87466
  • y=−114.32022
  • y=−116.22668
  • y=−118.79078
Zeta function between 120i and 1−140i Zeta function between 1−120i and 2−140i

ζ(x+iy) for y between −140 and −120
Zeros in this interval:

  • y=−121.37013
  • y=−122.94683
  • y=−124.25682
  • y=−127.51668
  • y=−129.57870
  • y=−131.08769
  • y=−133.49774
  • y=−134.75651
  • y=−138.11604
  • y=−139.73621
Zeta function between 140i and 1−160i Zeta function between 1−140i and 2−160i

ζ(x+iy) for y between −160 and −140
Zeros in this interval:

  • y=−141.12371
  • y=−143.11185
  • y=−146.00098
  • y=−147.42277
  • y=−150.05352
  • y=−150.92526
  • y=−153.02469
  • y=−156.11291
  • y=−157.59759
  • y=−158.84999
Zeta function between 160i and 1−180i Zeta function between 1−160i and 2−180i

ζ(x+iy) for y between −180 and −160
Zeros in this interval:

  • y=−161.18896
  • y=−163.03071
  • y=−165.53707
  • y=−167.18444
  • y=−169.09452
  • y=−169.91198
  • y=−173.41154
  • y=−174.75419
  • y=−176.44143
  • y=−178.37741
  • y=−179.91648
Zeta function between 180i and 1−200i Zeta function between 1−180i and 2−200i

ζ(x+iy) for y between −200 and −180
Zeros in this interval:

  • y=−182.20708
  • y=−184.87447
  • y=−185.59878
  • y=−187.22892
  • y=−189.41616
  • y=−192.02666
  • y=−193.07973
  • y=−195.26540
  • y=−196.87648
  • y=−198.01531

SVSU accepts no responsibility for the content of this page. Comments on this page should be directed to the page author.

Page created and maintained by Jan Hlavacek.