By participating in this section you will be able to:
- Differentiate between variables and constants
- Classify variables as qualitative vs. quantitative and discrete vs. continuous
- Explain why statisticians (including you) care about scales of measurement
- Describe the characteristics of the scales of measurement
- Identify the mathematical operations associated with each scale of measurement
- Label different data sets with their scales of measurement
- Produce examples of the different scales of measurement
Professor Weaver’s Take
When I was younger, my family played a game in which one had to identify a commonality among three items. It was challenging but loads of fun. Shall we play a few rounds?
- What do hair color, favorite pet, and presidential candidates have in common?
- What about the height of skyscrapers, annual earnings of movie actors, and number of fraudulent social security claims?
If you had a hard time making connections between these items it is likely because you haven’t yet learned of the factors that unite the items. The items in the first set are all qualitative variables measured on the nominal scale with discrete values whereas the items in the second set are all quantitative variables measured on the ratio scale with continuous values.
Classification Yields Information
There are a lot of terms in the last paragraph. If you don’t have a definition for those terms, that paragraph is just a list of confusing jargon. However, once you understand what those terms mean, you know if the concepts represent something that can be measured with numbers or just described with words. You will be able to judge if what is being measured can only be counted with whole numbers or if parts, fractions, and decimals are possible. You will know what kind of mathematical operations can be performed on the values.
Still not impressed? Let me foreshadow a little further. These classifications will guide you to the correct statistical analyses to the valid conclusions for those analyses. We will be revisiting these classification schemes throughout the course so you’ll have a lot of practice to set these into memory and see their worth.
Constants and Variables
Plato quoted Heraclitus when he wrote that everything changes and nothing stands still. Perhaps they were right but we still distinguish between constants and variables. As you may remember from previous math courses, a constant is a quantity that does not change whereas a variable is a quantity that can take on different values. For example, the number of biological parents needed for conception or number of oxygen atoms in a water molecule are both constants (i.e., 2). Scientists and statisticians are often more concerned with variables. Psychologists may be interested in assessing variables such as mood, memory, or personality, which can vary from person to person and from day to day.
A constant is a fixed quantity. It does not vary across observations.
We can add a few more layers of specificity to our variables. Quantitative variables, such as height or weight, have numbers as values because they represent the quantity of what is measured. Qualitative variables, such as hair color or type of pet, have words as values because they represent a particular quality of what is assessed. In short, if you can assign a number to a variable then it is quantitative but if you can assign a word to a variable then it is qualitative.
Qualitative variables have values that differ by kind or type whereas quantitative variables have values that differ by amount.
The last distinction among variables that we will make is between discrete and continuous variables. This classification has to do with the meaningful divisions of the values for a variable. A continuous variable is one that can have whole numbers, fractions, or decimals for values. For example, the mean cost of a soda across the United States would be considered a continuous variable because values such as $0.75 and $1.28 are both meaningful. A discrete variable is one that does not have meaningful divisions between values. For example, the number of children for a family is a discrete variable because a family cannot have 2.5 or one and three-quarters children. Furthermore, all qualitative variables are also discrete variables because one cannot meaningfully discuss the halfway point between one’s favorite vegetables (e.g., carrot and potato). As we’ll learn shortly, this is because one put the values of qualitative variables into a meaningful order.
A discrete variable has values that differ in whole values whereas a continuous variable has values that can differe by fractions or part of a who value.
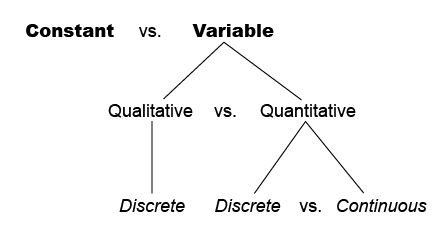
Figure 1. Comparison of Variables and Constant
What are Scales of Measurement
Scales of Measurement is a classification scheme. That is, it helps us group data into different categories so that we can more easily make judgments about what that data tells us and what we can do with that data.
I think you know my preference and I think that the second option should be your preference, too. Not just because statistics is fun (I’m getting excited thinking about all of the figures and charts right now!) but because statistics empowers you. By understanding the traffic patterns and the factors that influence them, you can have an extra 30 minutes sleep; how glorious! So, what can you do to find those days that allow you to get more sleep?
THE FOUR SCALES OF MEASUREMENT
(order is important)
NOMINAL SCALE: Values on this scale differ by category or name rather than quantity/amount.
ORDINAL SCALE: Values on this scale can be ordered in some way (e.g., smallest to largest, worst to best, etc).
INTERVAL SCALE: Values on this scale have order and equal amounts of difference between values.
RATIO SCALE: Values on this scale have order, equal intervals, and a meaningful zero (i.e., zero indicates absence of whatever is measured).
As you may have picked up throughout that list, each scale has a little more than the previous scale. But what is that something? Information! The higher the scale, the more information we can get from the value in the scale. Let’s examine this with some examples.
NOMINAL SCALE
These scales lack any indication of quantity and have no inherent ordering. When you think about what a nominal scale can tell you, think “name only.” Imagine you are choosing a statistics course based on the instructor. If you go to the course catalog, you will find a list of instructors offering the course. You don’t know who is better than others; you only have the names. Statistics instructor is a nominal scale.
ORDINAL SCALE
Ordinal scales have order to the values. That means that you can arrange the values from small to large, first to last, best to worst, etc. When you think ordinal, think “order”. The shortcoming if this scale of measurement is the lack of information about the difference between values. Imagine that you get a list of statistics instructors, each with a ranking from best worst. This ranking is on an ordinal scale. Unfortunately, you can’t get into the best instructors class but you can get into the second. You may wonder if there is much of a difference between the two instructors.
INTERVAL SCALE
The interval scale includes order of values but also has a fixed distance, or amount, between each value. To make a more informed decision about which instructor’s course to take, you go to a website in which students can give their instructors on a scale of -10 (terrible instructor) to +10 (wonderful instructor). An instructor who receives a score of -5 is ranked 10 points higher than an instructor given a score of +5. These rankings are on an internal scale. Does this mean that the second instructor is 10 times better than the first? To determine this, we need the ratio scale of measurement.
RATIO SCALE
The ratio scale has it all: order, equal intervals, and a “meaningful zero”. Wait, didn’t interval scale have a zero? Zero has to be between -10 and +10, right? The difference is that the zero on a ratio scale signifies an absence of what is being measured. That “meaningful zero” allows one to make an important conclusion about different values on that scale: one can form a ratio of those values (e.g., 4 / 3). That ratio means that the first value is one and one third times the second value.
Let’s get back to our example. You are trying to get some information about statistics instructors so that you can make a decision on which section in which to enroll. You are really motivated to get a good instructor so you go to the Office of Institutional Research (an office that keeps and analyzes all kinds of data about the University). That office gives you a simple metric for each instructor: the proportion of students who score a 90% or higher (e.g., the number of students scoring 90% or higher divided by the total number of students in the instructor’s sections) on a standardized statistics test at the end of the semester. You find that the top three instructors on the rating website are given the following proportions: Instructor A = 0.45, Instructor B = 0.40, and Instructor C = 0.32.
Given that the first instructor’s section is full, are you at much of a disadvantage by taking the second instructor’s course? You can check how many times more students get an A on the standardize test between the two sections: 0.45 / 0.40 = 1.125. This indicates that the first instructor helps 0.125 or 1/8 more students to get an A on that standardized test. Compare this to the difference between instructor B and instructor C: 0.40 / 0.32 = 1.25. The second instructor has .25 or 1/4 as many students getting an A than instructor C. Given this metric, it seems that instructor B is a good second choice.
Identifying Scales of Measurement
To decide which scale of measurement a set of values is measured on, you need to work backward. Start at the ratio scale, which offers the most information, then move through to the nominal scale, which offers the least information.
- Is there a “meaningful zero?” If you can say that the zero on the scale means that there is an absence of the attribute being measures, then you can declare it a ratio scale. One short-cut you might consider is whether negative values make sense. For example, you cannot have a negative count of items but you can have a negative reading from a thermometer measuring degrees Celsius.
Another good check is to change the coding of the information. Can you still make sense of the scale of you subtract, add, multiple, or divide by a constant. Again, this is the case with most temperature scales. You can easily concert between Celsius and Farenhiet by such procedures and the result still makes sense. This is not the case with count or frequency. Taking the number of students in statistics sections and multiplying by 10 then adding 341 changes the interpretation of the information.
If you answer this “no,” you need to move to the next question.
- Are the intervals between values equal? This question is asking if the difference between any two values is the same. For example, is the difference between 100 degrees Fahrenheit and 98 degrees Fahrenheit the same as the difference between 10 degrees Fahrenheit and 8 degrees Fahrenheit? In the case of temperature on the Fahrenheit scale, the answer is yes and the Fahrenheit scale is an interval scale. It can be more challenging to decide for a subjective rating scale. Think about asking individuals to rate how happy they are on a scale of 1 to 10. The difficulty with this example is that we don’t know if individuals are using a consistent mapping of happiness to the numbers on the scale. Someone may decide to go from a 3 to a 4 with a relatively small change in happiness but require a large change in happiness to move from a 9 to a 10. If you are in doubt about the equality of intervals, I suggest that you answer “no” to this question.
If you answer “no,” move to the next question.
- Is there an ordering of values? To answer this questions as yes, you need to be able to sort the values from one quality to another. For example, if you can sort from small to large, light to heavy, first to last, rough to soft, etc. then you have an ordinal scale.
If you answer “no”, then your values differ in no other quality than name. In this case, you have a nominal scale.
Why Identify Scales of Measurement?
It may take some practice, but identifying the scale of measurement can be easy. The ease of a task is not a reason, per se, to identify the scale of measurement. The real value is in directing the type of mathematical operations and later the type of statistical analyses that are appropriate for the scale of measurement.
Table 4.1
Mathematical Operations for Scales of Measurement Scale of
| Measurement | Appropriate Operations |
|---|---|
| Nominal | Count |
| Ordinal | Count, Order |
| Interval | Count, Order, Add/Subtract |
| Ratio | Count, Order, Add/Subtract, Multiply/Divide |
As the table indicates, ratio scale allows for the most mathematical operations because it allows for all of those that are appropriate for the scales below it but including multiplication and division.
Practice
Now that you know how to identify the scales of measurement and that you know which operations are associated with each scale, give these practice problems a try.
Review
Not all data are the same. At a basic level, observations can be constant or variable. Those that have differing values (variables) can have qualitative or quantitative values. Furthermore, those quantitative variables can vary continuously or discretely. These divisions have important implications on the types of analyses that we can perform on the different kinds of data.
Classifying the scale of measurement can help to guide the choice we make about the types of mathematical manipulations that are appropriate for our data. Importantly, it helps to prevent us from making claims that are not appropriate. For example, it would be inappropriate to tell someone that one resataurant is twice as popular than another becaue it was rated a 4 rather than a 2 on a scale that ranged from -5 (most terrible) to +5 (most excellent). At best, we should report that the first restaurant was ranked higher than the second because our scale of measurement is an ordinal scale.
Here are the four scales:
-
Nominal Scale: Values on this scale differ by category or name rather than quantity/amount.
-
ORDINAL SCALE: Values on this scale can be ordered in some way (e.g., smallest to largest, worst to best, etc).
-
INTERVAL SCALE: Values on this scale have order and equal amounts of difference between values.
-
RATIO SCALE: Values on this scale have order, equal intervals, and a meaningful zero (i.e., zero indicates absence of whatever is measured).
Here are the appropriate operations:
-
Nominal Scale→ Count
-
ORDINAL SCALE→ Count, Order
-
INTERVAL SCALE→ Count, Order, Add/Subtract
-
RATIO SCALE→ Count, Order, Add/Subtract, Multiply/Divide
Where We're Going
This section introduced the importance of classifying the type of data we have. These classifications help to direct how we manipulate, summarize, and analyze the data. We'll further describe our data by summarizing the number of each type or group of observations we make in frequency distributions.
Before we move on to frequency distributions, please complete and submit the homework found by pressing the "Next" button below.
After you've submitted the homework, take the section quiz.