Complex domain coloring images of functions with essential singularities.
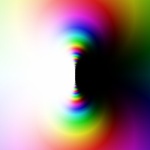
Exp(1/z) gas an essential singulariy at 0. Notice the repeating rainbow: if you don't understand what is going on,
pick up a complex analysis textbook and look up Picard's Great Theorem.
|
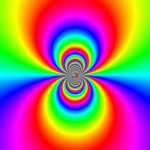
This is the same function, this time ploting argument only.
|

Exp(1/z2)
|
 |
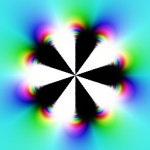
Exp(1/z5)
|
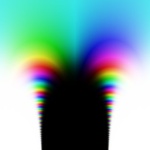
Exp(1/z20), this time centered at z=i. Looks sort of like a cave.
|
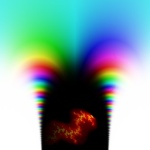
Every self respecting cave must have a dragon in it, right? Luckily, GIMP
has a Fractal Explorer plugin. A little piece of a Julia set and a fierce dragon is here.
|
 |
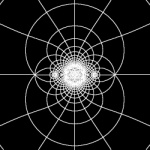
Sin(1/z)
|
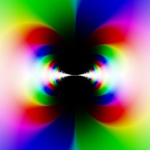
This is zsin(1/z) at 0.
|
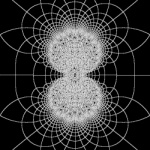
This is a reverse image of a radial grid by zsin(1/z), subsequently bump mapped several times to create this interesting \"lace\".
|
 |

This picture is a bit different. This is a cylindrical projection of the Riemann sphere colored by the function exp(z). The entire top edge is actually the north pole, or the point at infinity. The bottom edge is the south pole, or 0. You can see the essential singularity at &infinity;.
|


